The Rise and Rise of Income Inequality

Most of today’s problems don’t spring from lack of wealth; as a matter of fact, global levels of wealth have increased exponentially with the advent of technological advancements. The problem people face today is that of income inequality and wealth inequality. This is evident if we look at the Gross domestic product (GDP) growth of countries over the years. GDP is the total monetary or market value of all the finished goods and services produced within a country’s borders in a specific period. In other words, GDP measures the size of a nation’s economy.
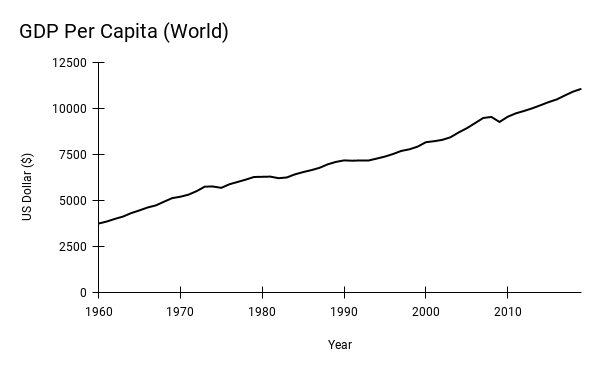
Fig-1- Global GDP per Capita.
When we look at GDP per capita (which is calculated by dividing the GDP of a nation by its population) over the years, we see a positive trend that indicates the wealth of nations has significantly increased. But such a representation can be misleading. One, GDP does not take into account the skewed wealth distribution. For instance, in India, 73% of the wealth generated in 2017 went to the wealthiest 1%. Second, the well-being of a nation and its people cannot be judged solely by the amount of wealth they have, and that’s why many economists disagree on whether GDP is the correct measure of a country’s welfare. Thus, depending solely on the patterns of wealth distribution to assess a nation’s development isn’t accurate.
An alternate indicator of assessing a country’s development is the Human Development Index, a combination of the life expectancy, the literacy rate, and the purchasing power parity (the financial ability to buy products and services) of a nation’s citizens. In 2019, India was ranked 129th out of 189 countries with an HDI score of 0.647. Norway claimed 1st place with an HDI score of 0.954 and Niger came last at 189th place with an HDI score of 0.377.
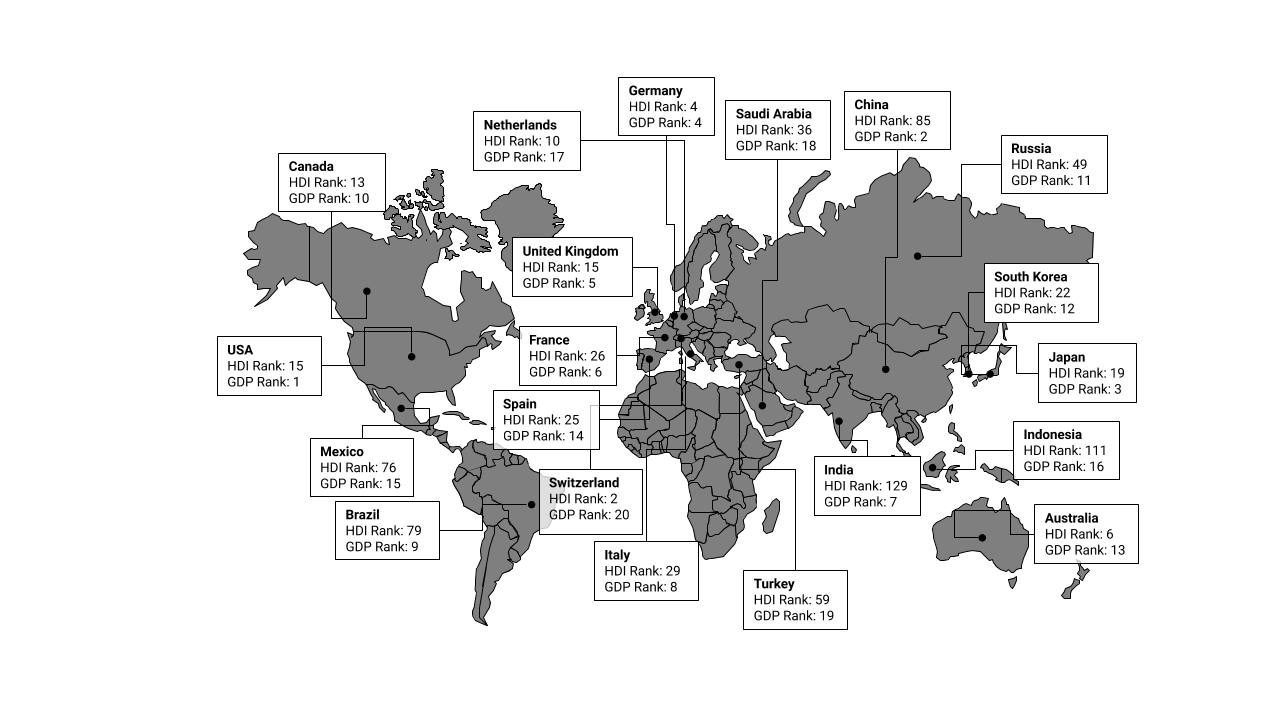
Fig-2- GDP and HDI Comparison.
The above graph shows the GDP ranking of a country vs. the HDI ranking. It shows how countries with a high GDP can have a bad Human Development Index score. For example, if we look at a country like the USA, it ranks No.1 in the world in terms of GDP but ranks 15th for HDI. India, which has an HDI rank of 129th out of 189 countries, ranks 7th globally in terms of GDP.
One of the reasons for this dissonance between GDP and HDI is wealth distribution. Today, the world doesn’t face a wealth crisis but rather a wealth distribution crisis. Simply put, wealth is unequally distributed across people. The Covid-19 pandemic further widened this gap, as the combined wealth of the world’s billionaires crossed the $10 trillion mark, with their wealth increasing by over 27% between April 2020 to July 2020. During the same period, half a billion people were at risk of being pushed into poverty. The pandemic only widened the gap in wealth distribution across the globe.
Table of Contents
Why does income and wealth inequality exist?
In 1896, Italian Economist Vilfredo Pareto studied the distribution of land across Italy; he saw a trend wherein 80% of Italy’s land was owned by the top 20% of its people. Pareto continued his analysis until a larger pattern began to emerge. He found that most resources were always constrained among a small percentage of people, which later came to be known as the Pareto Principle. Examples of the Pareto principle exist everywhere and can be seen in sports too. It’s always a few countries that dominate in the Olympics by winning most of the medals. The Pareto Principle is also apparent, as can be seen by observing the dominance of a few species over their ecosystems.
The Pareto Principle is caused by the ‘sensitive dependence of a system on initial conditions’ in which a small change in one state of a deterministic nonlinear system can result in large differences in a later state. This creates an accumulative advantage (or disadvantage). What begins as a small advantage, over time, gets bigger, creating a cascade of cause and effect that favors the side having a slight edge in the beginning. It’s the same reason why the rich get richer, and the poor get poorer. The reasoning itself is simple: a slight advantage in a competitive world can translate to absolute victory. For example, a runner wins by 10ms in a race but takes away the absolute triumph, which in turn gives him access to more resources to continue his dominance over his opponents who, even though lost by less than a second, earned nothing. In simpler words, the winner gets one point, and the loser gets zero. Most of the transactions in life don’t work in such simple binaries, but they do exist partially and compound over time. For example, in our world, the rules are bent in favor of the richest and more powerful people. If we were to use the race analogy, we could say that rich people get a headstart while the poor don’t even possess basic facilities, like a pair of shoes to put on during the race.
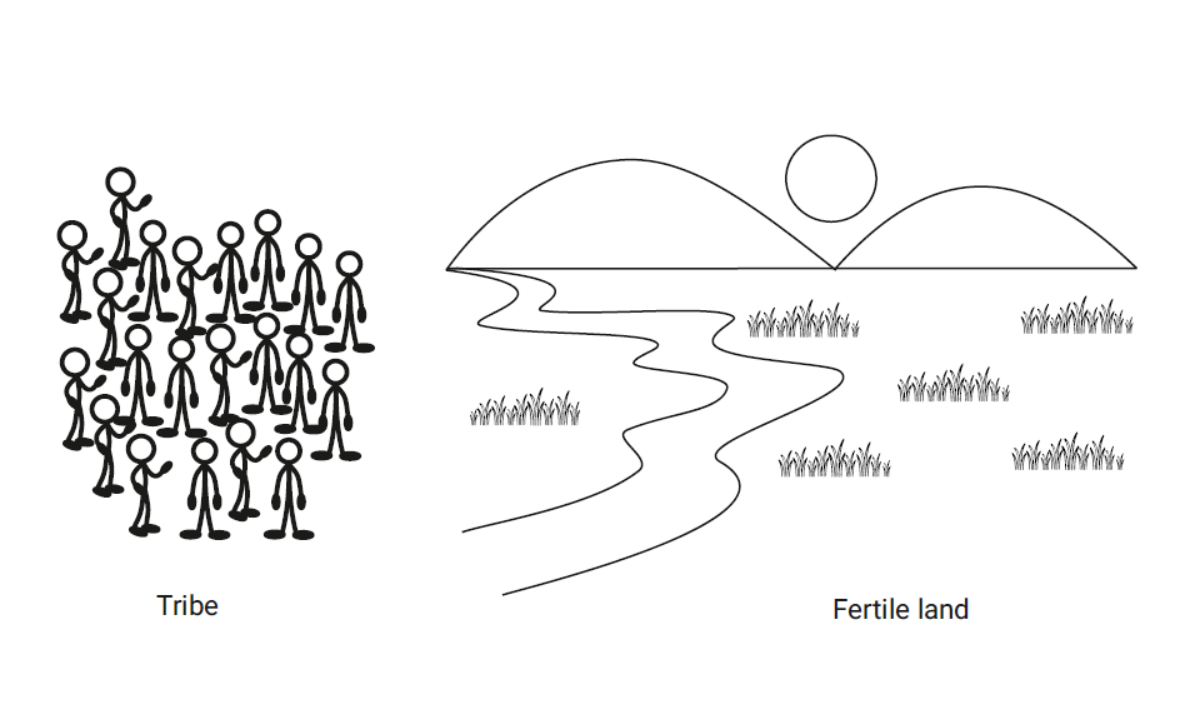
Fig 3- Simplistic thought experiment.
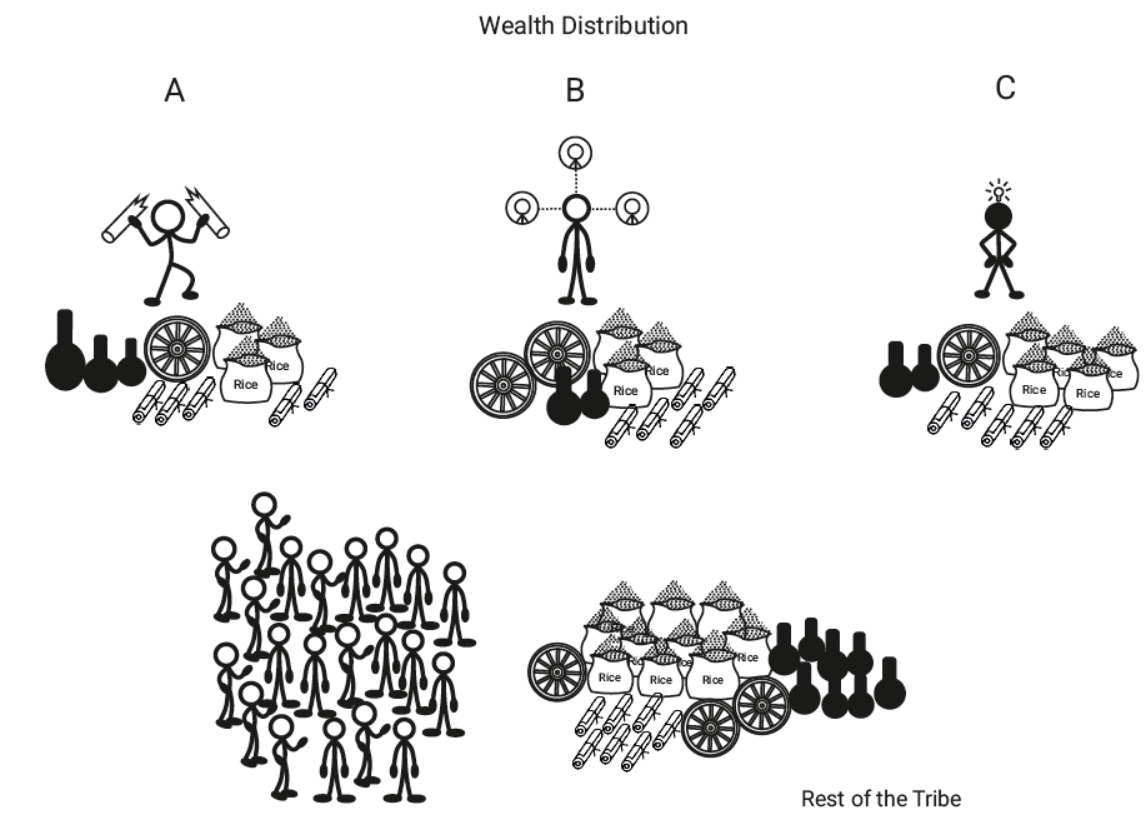
Let’s conduct a thought experiment. If we were to go back in time and observe a society’s emergence from scratch, we would observe the Pareto principle to be an inevitable reality. Imagine a hunter-gatherer tribe of 30 people living in a post ice age era where favorable climate conditions allowed for agricultural activities. Let’s suppose these 30 people find fertile land of 50 acres near a river and discover the art of farming. Over time, the power dynamics would play out in such a way that a select few people who possess luck, timing, strength, intelligence, looks, and fertility will emerge with an advantage over the rest. Suppose three people enjoy initial success. Person A is the strongest and therefore gets the most work done and is also feared by most people. He simply has a physical and genetic advantage over others. Person B is the smartest and comes up with the best farming techniques; everyone seeks her farming expertise. Person C possesses good social skills and acts as the tribe’s mediator. Furthermore, let’s say these three people are favored by luck and timing as well. Their crops are not infected by pests, and they enjoy good crop yields. If the tribe adheres to a barter system of trading goods and services, these three people will emerge with an initial advantage over the rest of their 27 companions.
Fig 4- Few people are conferred with initial advantages like luck, strength, intelligence, health, etc.
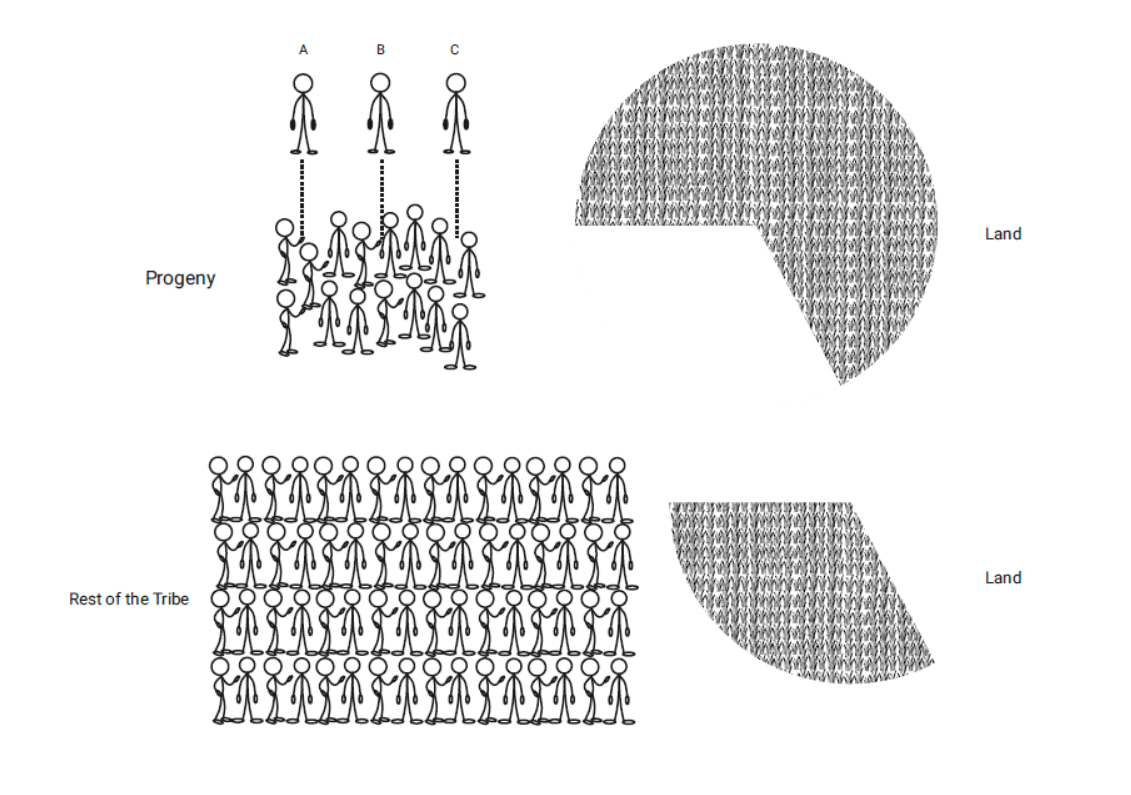
As time progresses, the process of accumulative advantage will favor these three people. Fast forward two years, and we will observe that persons A, B, and C will possess more goods (grain) and resources (land) than everyone else. Let’s say A, B, and C now own 5 acres each, and the rest is distributed unequally between the remaining 27 people. Let’s assume that the tribe remains mostly plague free and the climate conditions are favorable enough to allow a population explosion to take place. 25 years later, what do we see? Let the population be 200 people, and the available land be 100 acres. The accumulative advantage would further compound the number of resources and goods owned by persons A, B, and C. In fact, not only would persons A, B, and C enjoy the benefits of accumulative advantage, their progeny would also inherit this advantage.
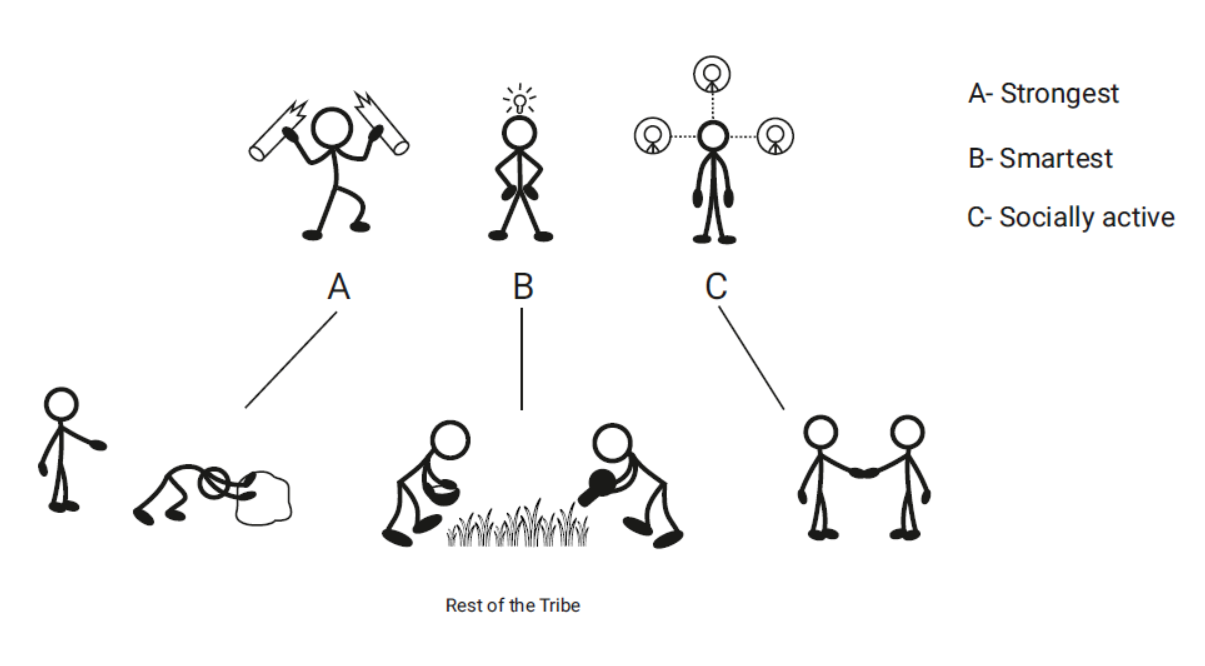
Fig 5- Accumulative advantage at work.
We can see that A, B, C, and their progeny (say 15 people) possess 35 acres of land now. The rest is unequally distributed among others. We will observe that the A, B, C groups will now worry less about food than their fellow tribesmen in our simple society. Their progeny will be healthier, more productive, and more likely to be larger in numbers due to the availability of resources. In comparison, the rest of the tribe will always have to worry about making ends meet, the fear of scarcity will always loom over their lives.
Fig 6- A, B, C generations will own more resources compared to the rest of the tribe as time progresses.
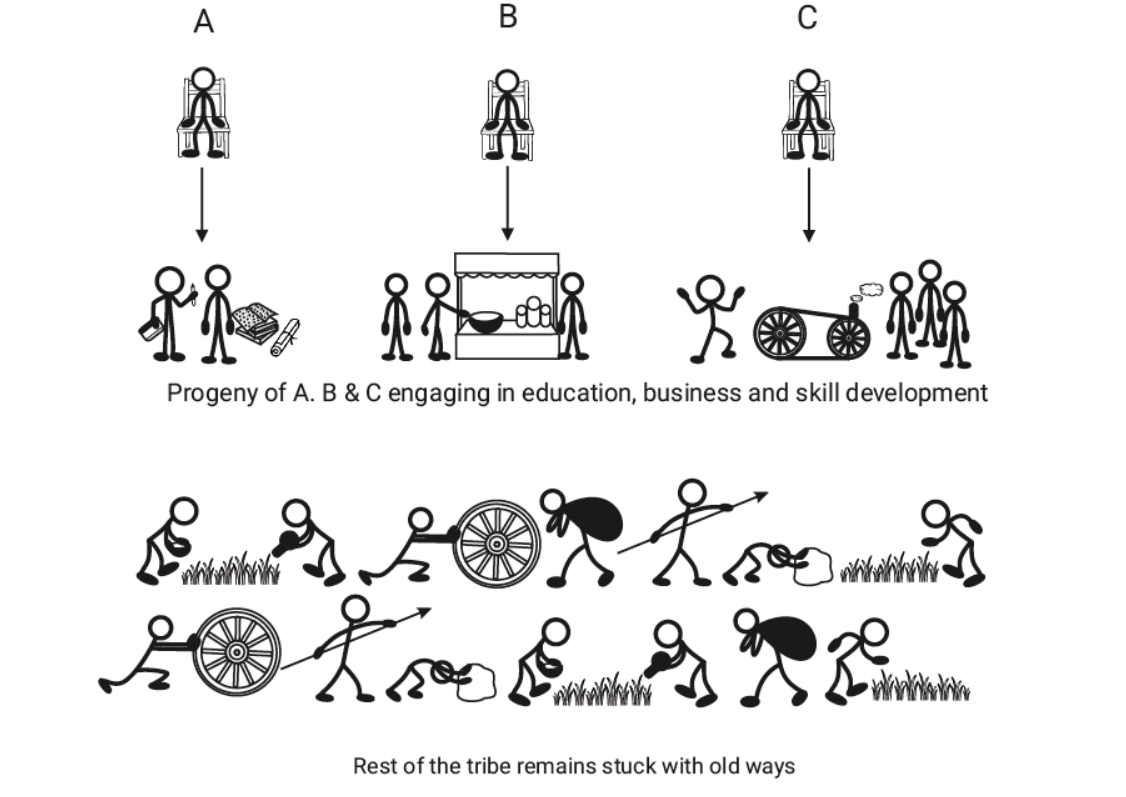
As time passes, the A, B, C generations will spend less time doing physical labor. They will be able to outsource the laborious tasks to other society members — most likely new settlers and people faced with abject poverty. The A, B, C generation will now be able to utilize their newfound time to educate themselves, develop new skills, establish new business relations, and further expand their wealth and influence in their society. The core idea of the thought-experiment is a simple truth that most of us know: Rich families pass their advantages to their kids while low-income families pass their disadvantages. The cycle continues for generations until a strong external force (intervention) disrupts it.
Fig 7- A, B, C generations engage in education, business and skill development.
Of course, a typical society is much more complex with innumerable factors governing its future, but the underlying principles stay the same: the sensitive dependence on initial conditions and the principle of accumulative advantage. Together, these give rise to the Pareto principle—a perfect recipe for income inequality to arise. In simpler words, small yet significant benefits conferred to persons A, B, and C at the beginning had a considerable positive effect on the future outcomes of their lives and that of their progeny. Their advantages snowballed over time, providing them with greater opportunities, which allowed them to emerge on top of the food chain. There are real-world examples to illustrate these principles.
Consider the bombing of Nagasaki. The US air force was initially planning to bomb a munitions factory in the Japanese city of Kuroko, but on the day of the planned attack, bad weather prevented the pilots from identifying the factory. It is said that the aeroplane passed over the city three times but was prevented from striking due to cloudy weather. The military personnel decided to bomb Nagasaki instead as the visibility was better. The weather that day (one factor) changed the future course of Kuroko and Nagasaki. Millions of lives would have progressed differently, and who knows how it would have shaped Japan’s future. We observe how small factors can cause enormous long-term differences that can have a compounding effect on the future course of events. The bombing of Nagasaki is a dramatic example. In day to day life, the consequences aren’t as dramatic or as quantifiable.
In his book ‘Outliers: The Story Of Success, Malcolm Gladwell‘ talks about how professional hockey players success in Canada is not just based on their merit. When Gladwell looked at the birth dates of most professional players in Canada, he observed that 40% of them are born in January, February, and March. Gladwell explains that the cut-off date for playing hockey in a given age-class in Canada is January 1st. A child born in January has an eleven-month advantage over another child born in December in the same year. Both children will be playing in the same league, but the child born in January (or in the earlier months of the year) will more likely be physically stronger and more coordinated than the child born in December (or in the later months). Over time, children born in the earlier months get better opportunities as time progresses— locking them in a positive feedback loop.
The situation is perfectly summarized by the Matthew effect (a derivative of accumulative advantage) which implies that those who already have status are often placed in situations where they gain more, and those that do not have status, typically struggle to achieve more. The Matthew effect is derived from the Book of Matthew in the Bible which states “For to everyone who has, more shall be given, and he will have abundance; but from him who has not, even what he has will be taken away.” (Matthew 25:29)
Perhaps a more relevant example of the Mathew effect in relation to inequality in the socio-economic system can be witnessed in unpaid internships. By their nature unpaid or underpaid internships allow privileged students to capitalize on opportunities that are not available to the underprivileged students who simply can’t afford to work without a pay. The students from lower-income backgrounds can’t participate in unpaid/underpaid internships as they need the money to afford rent and food, a concern that privileged students hailing from higher-income families don’t have to worry about. Let’s consider a simple example of two second-year college students seeking internships to build their resume. Suppose one comes from a privileged background, and another comes from an underprivileged background. The privileged student will have a bigger pool of internships to choose from as he can afford to bear the cost of an unpaid/underpaid internship, including moving to a new city, affording the rent, paying for food, and daily commute.
On the other hand, the underprivileged student will have to compete with others for a small pool of well-paid internships. Suppose both the students get an offer for an underpaid internship. The privileged students will easily accept, while the underprivileged student will have to let the offer go. In the third year of college, when both the students apply for internships, the cycle will repeat. Again, the privileged student will have the upper hand economically in addition to the work experience from the previous year’s underpaid internship. He will most likely be accepted by the system, being able to afford another underpaid internship. In comparison, the underprivileged student will be deprived of opportunities because of a flawed system. After the students graduate, the disadvantaged student will not have relevant work experience to show for and will find it difficult to get a full-time job. Contrastingly, the privileged student will have ample work experience to get him a full-time job. Over time, the accumulative advantage will favor the privileged student who will get relatively wealthier compared to the underprivileged student who will struggle to escape the cycle of systematic economic oppression.
Article 23 of UN’s Universal Declaration of Human Rights reads, “Everyone who works has the right to just and favorable remuneration ensuring for himself and his family an existence worthy of human dignity, and supplemented, if necessary, by other means of social protection.” In his annual lecture for the Nelson Mandela Foundation in 2020, UN Secretary-General Antonio Guterres said, “Inequality starts at the top in global institutions. Addressing inequality must start by reforming them.” Ironically, the UN, an organization that is supposed to champion the fight against inequality, itself benefits from unpaid internships and is guilty of perpetuating it. Between 2012-2013, the United Nations employed more than 4,000 unpaid interns.
This is in striking contrast to what the UN High Commission for Human Rights in December 2018 said about unpaid internships that they “exclude de facto the most marginalized” and “limit young people’s freedom to choose.” Access to sufficient funds remains an unspoken requirement for internship eligibility at the UN. In 2017, 87 per cent of respondents to the Fair Internship Initiative Global UN Internships Report came from upper-middle or high-income countries. If an organization like the UN, responsible for creating equal access to opportunities at a global scale, fails to hold up its values, one can only imagine how things are like in a capitalist system driven by incentives to maximize profits and minimize costs.
At a macro level, too, we can observe accumulative advantage at work when we look at the GDP per capita of colonized nations vs. the nations who were the colonizers. The graph below shows how the colonizer countries who became nation-states much earlier have a much higher GDP per capita than the colonized nations (like Vietnam, India, Nigeria, Sudan).
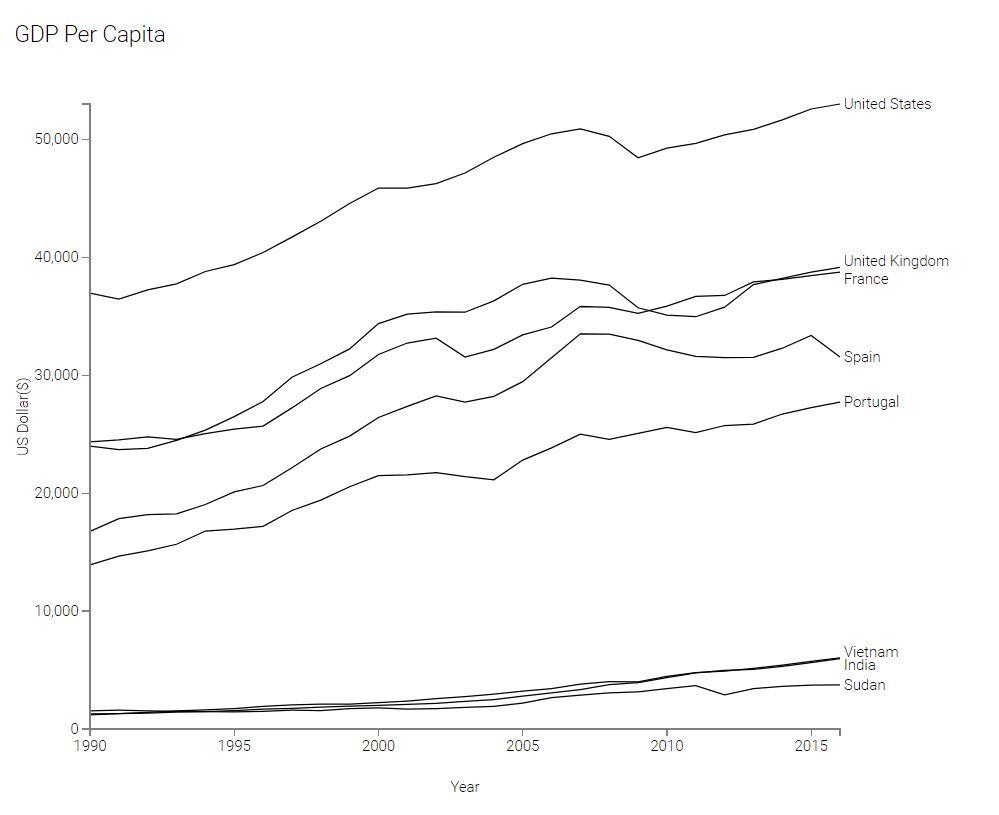
Fig-8-GDP Comparison between Colonised and Colonisers.
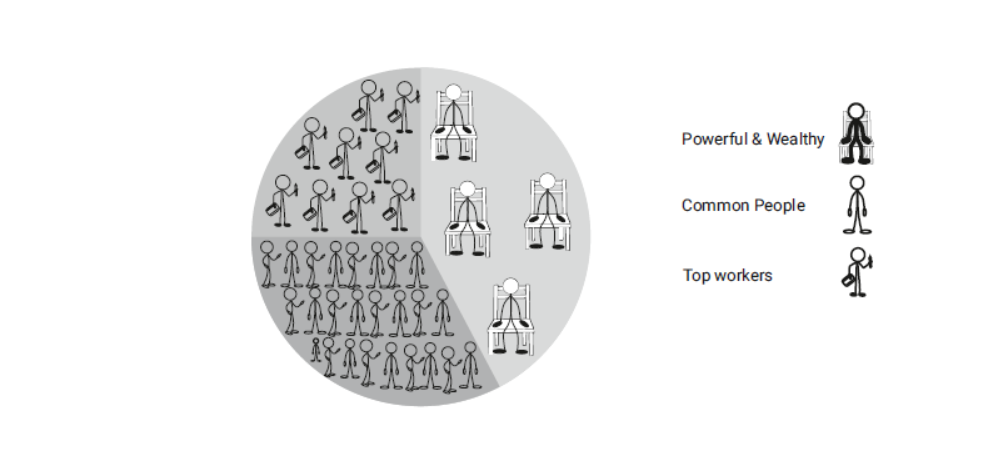
Now let’s go back to our imaginary society in our fictional world and stretch our thought experiment.
Fig 9- Wealth and power is concentrated among a few individuals.
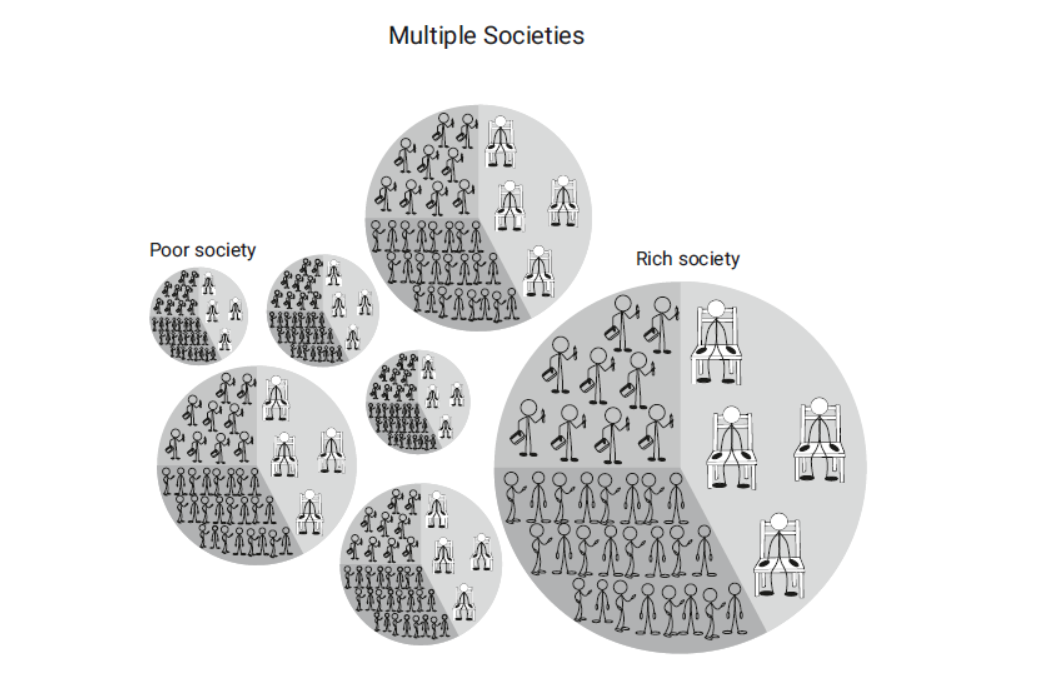
If we were to zoom out, it would look something like this:
Fig 10- Cluster of societies where a few societies are richer than others. Inequality within individual societies remains consistent.
If we zoom out further, we would see something like this:
Fig 11-Multiple nations with unequal wealth distribution through every level of settlement hierarchy.
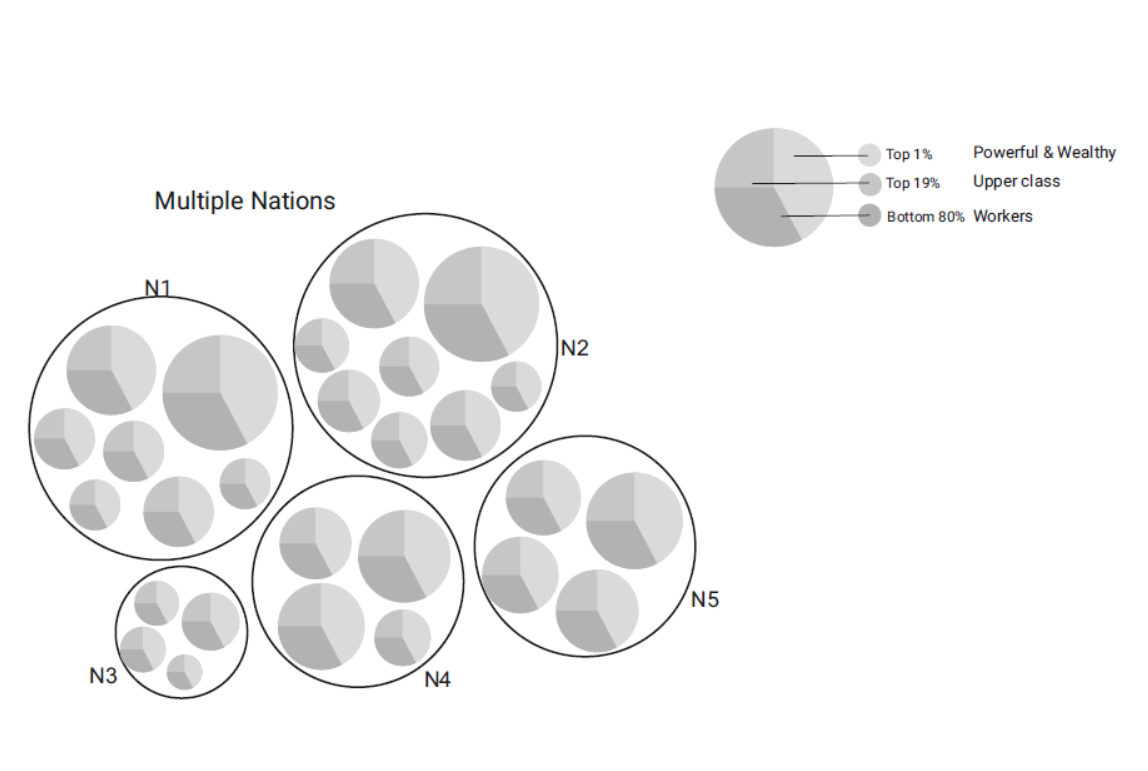
Again, the real world is infinitely more complex with societies that are intricately interconnected with each other. There are families, clans, bands, tribes, villages, towns, suburbs, cities, districts, and states; together, these elements form a nation. And at every level of the settlement hierarchy, we observe income inequality arises with time. Income inequality that over time leads to irregular wealth distribution. However, there are multiple checks and balances to prevent inequality and its consequences from getting out of control. We have laws, governments, media, courts, bureaucracies, NGOs, police, and other organizations that ensure society functions within established norms. These agencies are established to tackle various problems that societies (may) face — often rooted in injustice and inequality.
Governments exist to set and implement rules for its citizens to protect them from conflicts and ensure law and order prevails in society. Governments provide public goods and services, provide the legal and social framework, maintain competition, redistribute income, correct for externalities, and stabilize the economy. The government limits market failure through the regulation of markets, e.g., regulations on environment/labor markets/monopoly. They use fiscal and monetary policy to prevent recession and control inflation. Through its various frameworks, the government is always working towards improving the country’s economy and reducing poverty and inequality. In a corruption-free nation, governments ensure that equal opportunity is presented to all citizens to prosper socio-economically.
On the other hand, the media plays a role in keeping the government and the public informed about the entire nation’s socio-economic and political state. Freedom of the Press and good governance are mutually inclusive. A pluralistic and independent news media facilitates transparency and helps shape public opinion. It highlights public grievances that arise from socio-economic injustices and inequality. Media, therefore, acts as a bridge between the people and the government.
The courts, police, and bureaucracy try to ensure that citizens don’t face injustice or discrimination. The NGOs work to promote social or political change on a broad scale or locally. Together, all these agencies act like cogs that drive the engine of the nation forward.
However, despite these checks and balances, what we observe is that inequality persists. When we look at the data, we can see that our reality is not far from our hypothetical societies regarding wealth and income distribution across nations.
Let’s analyze the wealth distribution patterns across the world. For the sake of simplification, let us narrow down the entire world population of 7.8 billion to 1,000 people and all the wealth of the world’s nations ($360 trillion) to $10,000. It would be equitable if every individual would get $10, but of course, that is impossible in the world we live in. In the graph below, the world’s population is segregated in ascending order from the least wealthy to the most wealthy. We observe that 566 people hold $0.31(cents) wealth on average per person, 326 people possess $4.75 on average per person, 98 people have $39.67 on average per person, and 10 people hold $438.75 on average per person.
Fig 12- Global wealth distribution.
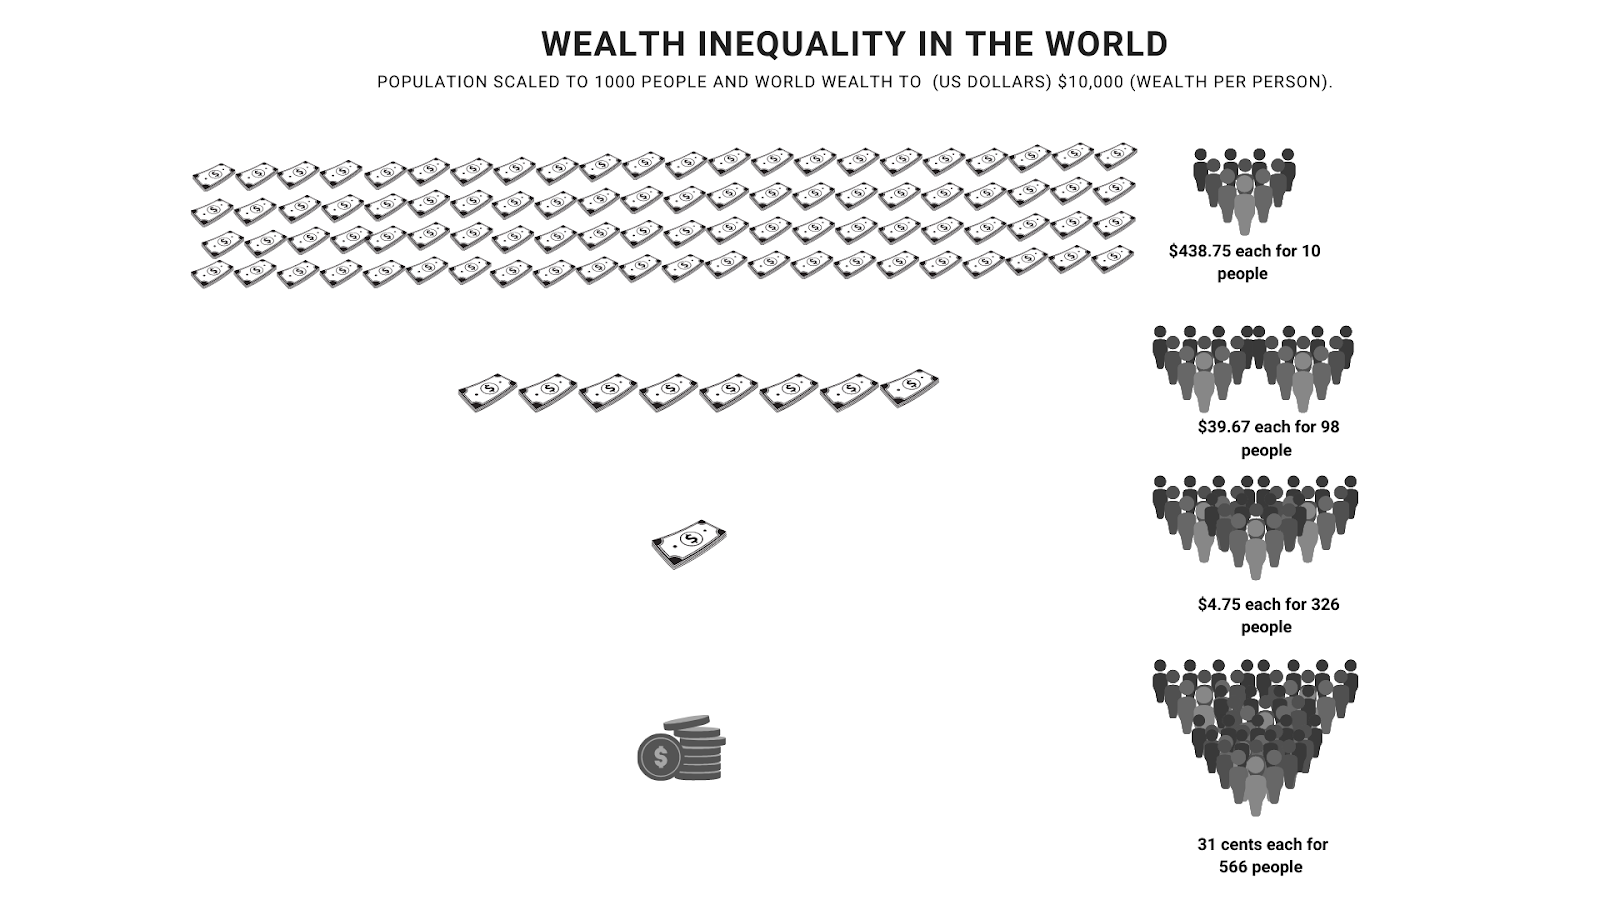
In terms of percentages, we observe that 57% of the world population owns just 2% of the world’s total wealth, and 32% of the population owns 15% of the world’s overall wealth. In contrast, the top 10% of the world’s population owns 39% of its wealth, and the top 1% owns 44% of the world’s wealth. That’s how skewed wealth distribution is in the world.
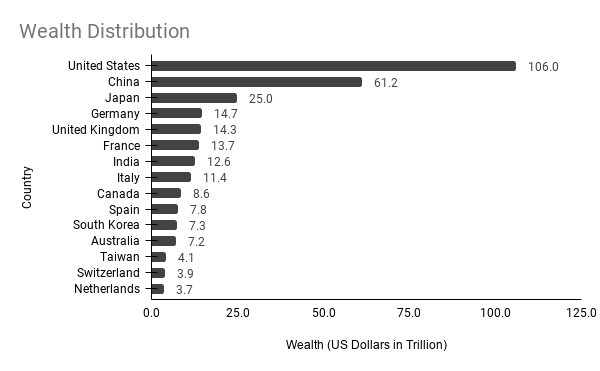
Fig 13- Top 15 countries own 85% of the total global wealth.
Let’s also look at how wealth is distributed across countries. With the global wealth standing at $360 trillion, we observe that the US and China own $105 Trillion and $63.38 trillion of the overall global wealth, respectively — which is more than the collective wealth of the bottom 185 countries in the world. By themselves, the top 15 countries own approximately $304 (85%) trillion out of the total $360 trillion. Again, we see a clear pattern — the world’s wealth is bottled at the top end of the pyramid.
Now let’s zoom in and look at wealth distribution in the fastest-growing major economy globally, i.e., India, and the wealthiest nation in the world, i.e., the US.
Suppose we scale down India’s entire population (1.3 billion) to 1,000 people and its total wealth ($12.6 Trillion) to $10,000. In that case, we see that 500 people hold an average wealth per person of $0.56 (cents), 400 people have an average wealth of $5.75/person, and the top 100 people possess an average wealth of $74.3/person.
Fig 14- Wealth distribution in India.
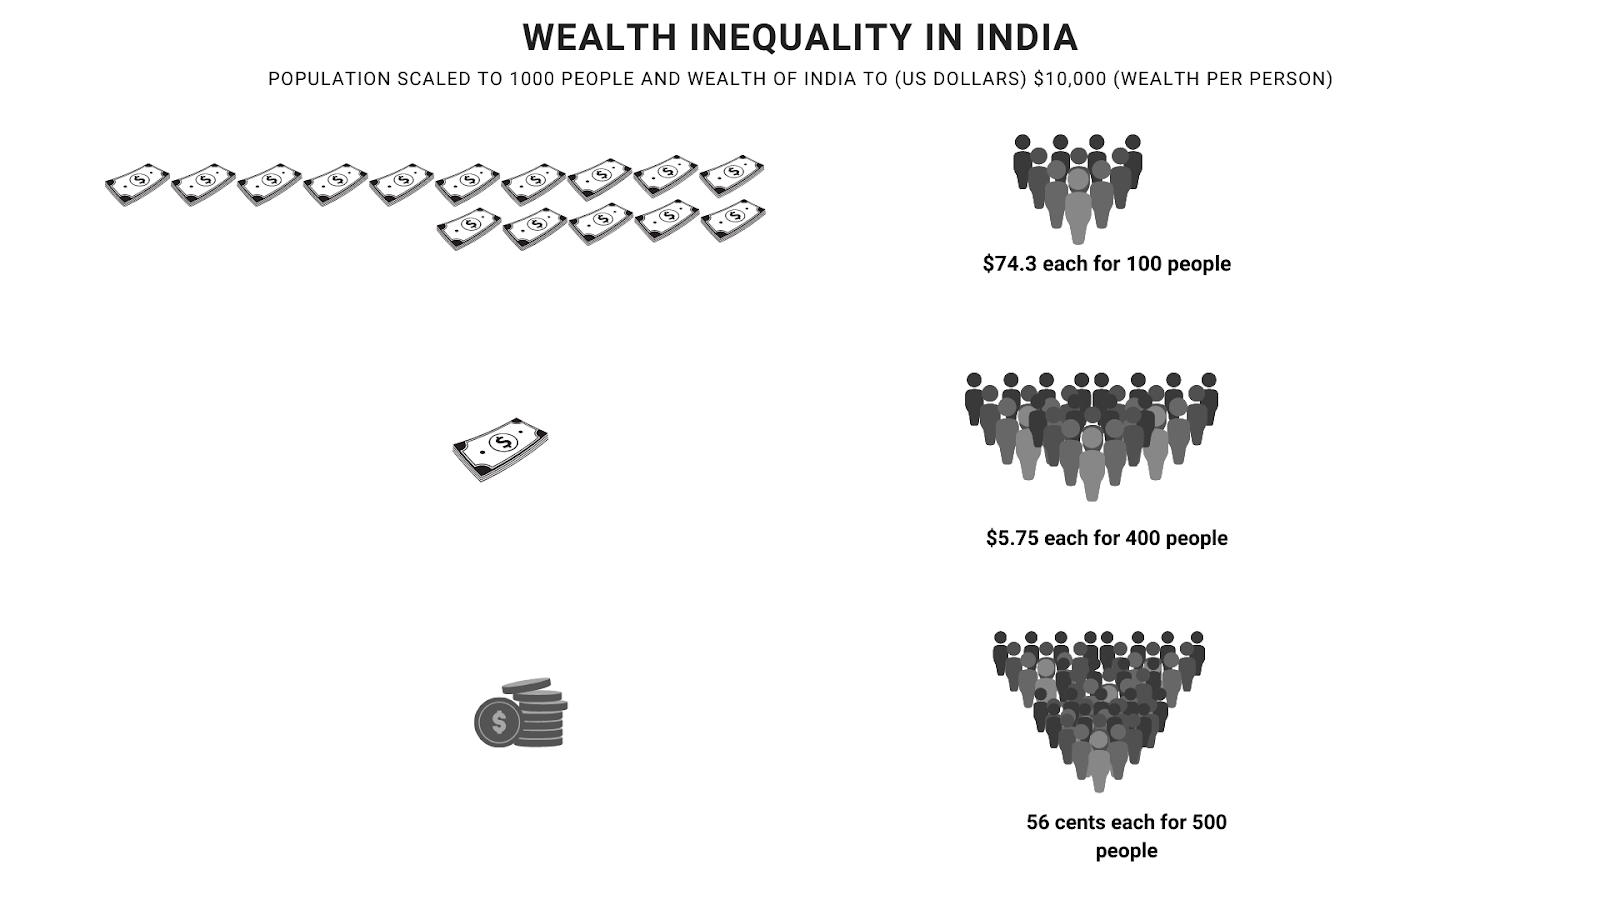
In terms of percentages, the country’s bottom 50% of people own just 2.8% of the total wealth, 40% of people own 23% of the total wealth, and the top 10% own 74.3% of the overall wealth. Here too, the pattern is undeniable: The richest few possess most of India’s wealth.
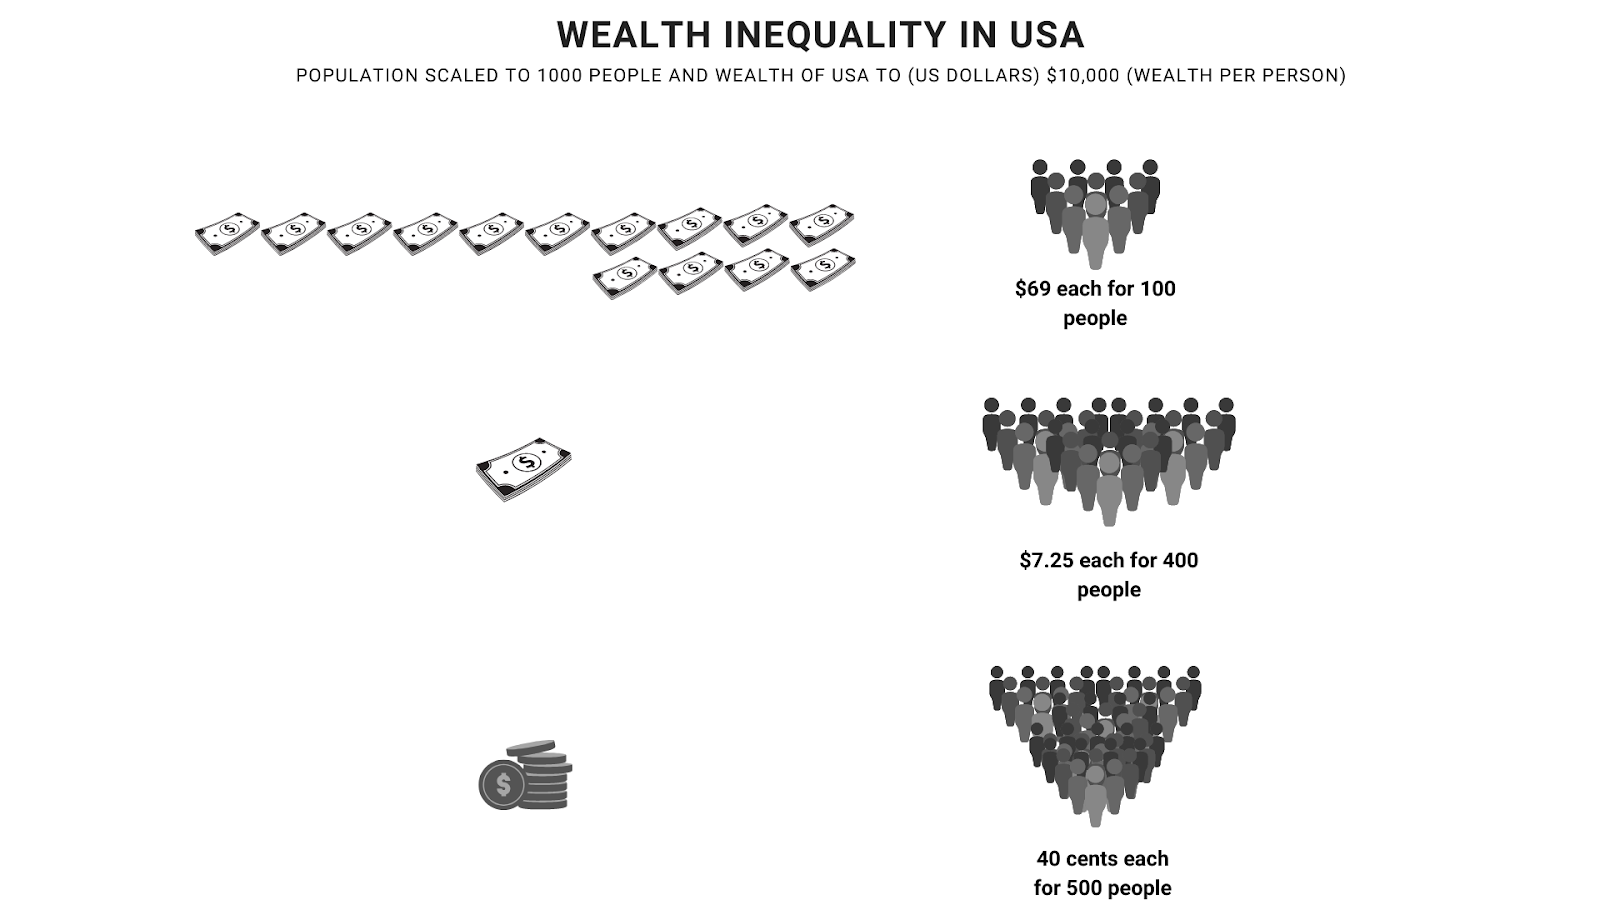
One would assume that the demon of inequality would spare the world’s most prosperous nation that owns almost one-third of global wealth, but if anything, wealth inequality is worse in the US. When we scale down the US’s total wealth ($105 Trillion) to $10,000 and the population (327 million) to 1,000 people, we find the same trends of wealth inequality. The top 100 Americans hold an average wealth of $69 per person, 400 Americans have an average wealth of $7.25, and the poorest 500 Americans possess an average wealth of $0.40 (cents) per person. In other words, the bottom 50% of the country’s population owns just 2% of its wealth, 40% of people own 29% of the total wealth, and the top 10% owns 69% of the country’s total wealth.
Fig 15- Wealth distribution in the USA.
The data reveals a grim reality: the rich are getting disproportionately wealthier, and the poor are getting relatively poorer. To decrease this widening gap between the rich and the poor, capitalism and the free enterprise system must work to address the inequality problem. In the current world scenario, inequality is the legacy of systematic oppression embedded in society through patriarchy, gaps in access to technology, racism, colonialism, and many other forms of injustices. These socio-economic structures perpetuate a lack of access to opportunities for the people at the bottom of the income pyramid. In such a world, there are bound to be social, political, racial, and gender injustices.
By Ravina Banze and Irfan Bashir
Citations
Ketto.org. (n.d.-a). Abandoned By Parents, This 6-Year-Old Girl Is Fighting Fatal Heart Disease. Help. Ketto. https://www.ketto.org/fundraiser/savesharmila

Abandonment | Encyclopedia.com. (n.d.). Encyclopedia. https://www.encyclopedia.com/social-sciences-and-law/law/law/abandonment#:%7E:text=The%20United%20Nations%20estimates%2060,children%20are%20abandoned%20each%20year.

Fernando, J. (2020). Gross Domestic Product (GDP). Investopedia. https://www.investopedia.com/terms/g/gdp.asp

GDP per capita (current US$) | Data. (2020). World Bank. https://data.worldbank.org/indicator/NY.GDP.PCAP.CD

Data taken from 2 sources: Credit Suisse. (2017). Global Wealth Report 2017. https://www.credit-suisse.com/about-us/en/reports-research/global-wealth-report.html

India: extreme inequality in numbers. (2019, October 19). Oxfam International. https://www.oxfam.org/en/india-extreme-inequality-numbers

2019 Human Development Index Ranking | Human Development Reports. (2020). UNDP. http://hdr.undp.org/en/content/2019-human-development-index-ranking

Neate, R. (2020, October 7). Billionaires’ wealth rises to $10.2 trillion amid Covid crisis. The Guardian. https://www.theguardian.com/business/2020/oct/07/covid-19-crisis-boosts-the-fortunes-of-worlds-billionaires

Wikipedia contributors. (2020h, November 11). Butterfly effect. Wikipedia. https://en.wikipedia.org/wiki/Butterfly_effect

Gladwell, M. (2011). Outliers: The Story of Success (Illustrated ed.). Back Bay Books.

Matthew Effect: Definition & Examples. (n.d.). Study. https://study.com/academy/lesson/matthew-effect-definition-examples.html

Sarah Jenkins on Twitter. (2020, June 21). Twitter. https://twitter.com/sarahjenkinsxo/status/1274499749643800578?lang=en

Universal Declaration of Human Rights. (2020, June 1). United Nations. https://www.un.org/en/universal-declaration-human-rights/

Secretary-General’s Nelson Mandela Lecture: “Tackling the Inequality. (2020, July 27). United Nations Secretary-General. https://www.un.org/sg/en/content/sg/statement/2020-07-18/secretary-generals-nelson-mandela-lecture-%E2%80%9Ctackling-the-inequality-pandemic-new-social-contract-for-new-era%E2%80%9D-delivered

Gani, A. (2017, November 29). UN employed more than 4,000 unpaid interns in 2012-13, figures show. The Guardian. https://www.theguardian.com/world/2015/aug/14/un-employed-thousands-unpaid-interns

Salter, E. (2019, March 14). The UN’s treatment of interns is peak hypocrisy – poor young people are not a disposable workforce. The Independent. https://www.independent.co.uk/voices/un-internships-unpaid-europe-human-rights-united-nations-a8820586.html

The Fair Internship Initiative. (2018). 2017 UN Internships Report. https://fairinternshipinitiativeorg.files.wordpress.com/2018/02/un-interns-report-2017.pdf

Roser, M. (2013, November 24). Economic Growth. Our World in Data. https://ourworldindata.org/economic-growth

Council for Economic Education, New York, NY. (2020). What are the economic functions of Government? https://www.unomaha.edu/college-of-business-administration/center-for-economic-education/teacher-resources/6-8/what-are-the-economic-functions-of-government.pdf

Pettinger, T. (2019, December 22). What are the economic functions of a government? Economics Help. https://www.economicshelp.org/blog/21699/economics/what-are-the-economic-functions-of-a-government/

Credit Suisse report 2019- Credit Suisse Research Institute. (2020). Global wealth report 2020. https://www.credit-suisse.com/about-us/en/reports-research/global-wealth-report.html

Kent, A. H., Ricketts, L. R., & Boshara, R. (2020, August 7). What Wealth Inequality in America Looks Like: Key Facts & Figures. Federal Reserve Bank of St. Louis. https://www.stlouisfed.org/open-vault/2019/august/wealth-inequality-in-america-facts-figures


1 Comment
Comments are closed.